In 2008 Microsoft offered 31 dollars a share for Yahoo, 62% more than Yahoo's last closing price. Coverage of the bid still measured it against a different number: Yahoo's 52-week high of 34.08 dollars, reached less than four months earlier. Press coverage noted that boards typically demand at least the 52-week high, 10% above Microsoft's offer.
A peak price from the previous year tells a buyer nothing about the cash flows of the company it is buying. It became the yardstick anyway, and across more than 7,000 US takeover bids, offer prices bunch at the target's recent peak prices.
Anchoring bias is the tendency for a numerical estimate or decision to be pulled toward a number considered just before it, even when that number is uninformative or chosen at random. The number is the anchor. Anchoring bias in investing most often runs through a purchase price, a 52-week high, a round number, an analyst's forecast or the first price named in a negotiation.
The wheel of fortune experiment, 1974
Amos Tversky and Daniel Kahneman described anchoring in "Judgment under uncertainty: heuristics and biases", published in Science in September 1974, alongside representativeness and availability. People who estimate a quantity often start from an initial value and adjust it, and the adjustment is usually too small, so different starting points give different answers.
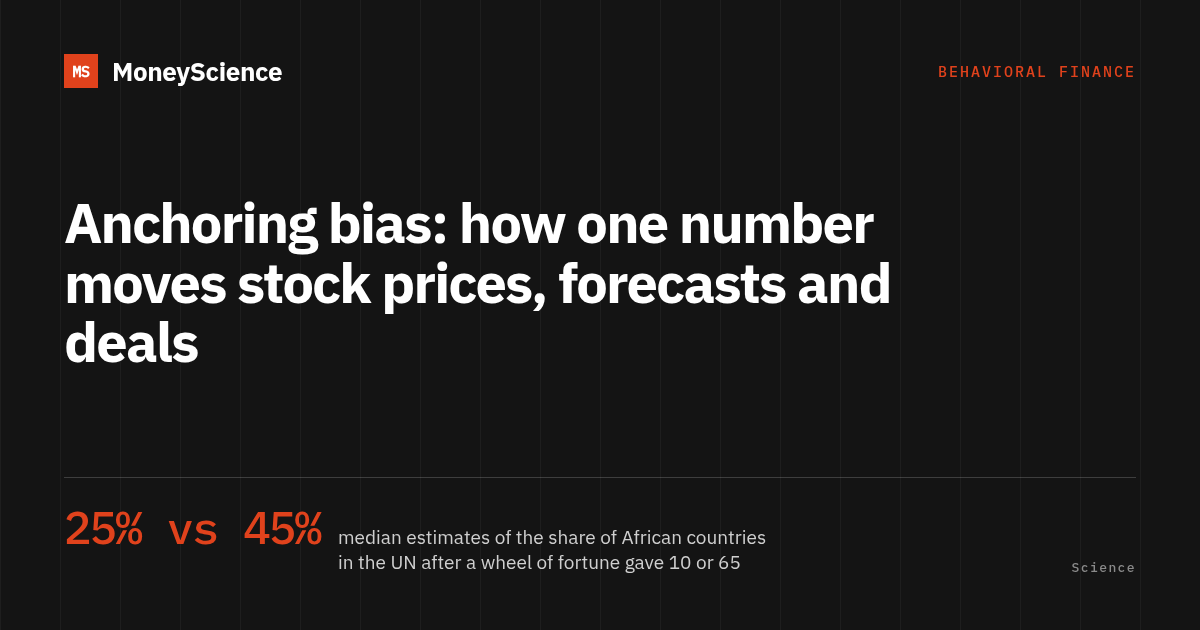
In their best known demonstration, a wheel of fortune was spun in front of participants to produce a number between 0 and 100. Participants said whether the share of African countries in the United Nations was higher or lower than that number, then gave their own estimate. The group that received 10 gave a median estimate of 25%. The group that received 65 gave a median of 45%. Paying people for accurate answers did not reduce the gap.
An anchor can also come from a person's own half-finished calculation. In the same paper, high school students had five seconds to estimate a product written on the board:
| Expression shown | Median estimate |
|---|---|
| 8 × 7 × 6 × 5 × 4 × 3 × 2 × 1 | 2,250 |
| 1 × 2 × 3 × 4 × 5 × 6 × 7 × 8 | 512 |
| Correct answer for both | 40,320 |
Students multiplied the first few numbers and extrapolated. The descending sequence gives larger early results, so it produced larger estimates, and both groups fell far short of the answer.
The social security number experiment
In 2003 Dan Ariely, George Loewenstein and Drazen Prelec took the idea from estimates to prices. At the first class of a market research course at MIT Sloan, 55 MBA students saw six products, including a cordless keyboard, a design book and bottles of wine. Each student first said whether they would buy each item for a dollar amount equal to the last two digits of their social security number, then stated the most they would pay, with a real chance that the purchase would go through.
Students with social security numbers in the top fifth of the class offered 55.64 dollars on average for the keyboard. Those in the bottom fifth offered 16.09 dollars. Across the six products, students with above-median numbers stated values 57% to 107% higher than those with below-median numbers. More than 95% of them still valued the keyboard above the trackball and the better-rated wine above the other. The authors called the result coherent arbitrariness: the level of the valuations was set by an irrelevant number, while the ranking between products stayed sensible.
How an anchor gets into a judgment
An anchor can reach a judgment through four routes, all reproduced in experiments since 1974:
- A comparison with a given number
- The classic design: the person first judges whether the true value is above or below a number, often presented as random, then gives an estimate. The wheel of fortune and the social security digits work this way.
- A number that looks informative
- A listing price in a property file, an asking price, a prosecutor's sentencing demand. The number arrives with the rest of the information and is treated as part of it.
- A self-generated starting point
- A partial calculation, as in the multiplication task, or a known value nearby. Asked for the freezing point of vodka, people start from 0°C, the freezing point of water, and adjust downward too little.
- A number seen in an unrelated task
- People who spent time copying pages of four-digit numbers later gave higher estimates of an unrelated quantity than people who had copied words.
Two explanations of anchoring have the most support. The oldest is Tversky and Kahneman's: people start at the anchor and stop adjusting too soon. It fits self-generated anchors well. The one with the most experimental support, selective accessibility, holds that comparing a target with an anchor makes information consistent with the anchor easier to recall. In 2006 experiments with legal professionals, judges who considered a high sentencing demand found incriminating arguments more accessible than judges who considered a low one.
The 52-week high and stock returns
The 52-week high is printed next to nearly every stock quote. From July 1963 to December 2001, a strategy that ranked US stocks each month by how close their price was to that high, then bought the stocks nearest it and sold those furthest from it, earned about 0.45% a month over six-month holding periods, in line with classic momentum strategies based on past returns. Nearness to the 52-week high predicted future returns better than past returns did, and the gains did not reverse in later years.
Thomas George and Chuan-Yang Hwang, who documented the pattern, attribute it to anchoring. When good news pushes a stock toward its 52-week high, traders use the high as a reference and hesitate to bid the price above it. The price reaches its new level with a delay, and that delay is the return the strategy collects. Because the move is a delayed adjustment toward value, there is nothing to reverse later.
The same reference point works at the level of the whole market. The closeness of the Dow Jones Industrial Average to its 52-week high predicted higher future market returns, while closeness to its all-time high predicted lower returns. The results held across the G7 countries. The 52-week high is public and free, so a return pattern built on it conflicts with the semi-strong form of the efficient market hypothesis.
Other biases, from overconfidence to herding, are covered in our overview of behavioral finance biases every investor should know.
Takeover bids and the target's peak price
Across 7,020 bids for US public companies announced from 1984 to 2007, the distribution of offer prices shows spikes at the target's 13-week, 26-week, 39-week, 52-week and 104-week highs. In many deals the peak price was the offer, with no adjustment at all.
- A bid slightly above the target's 52-week high was 4.4 to 6.4 percentage points more likely to succeed than a bid just below it, after controlling for the size of the offer.
- For each 10% of offer premium explained by the 52-week high, the bidder's own share price reaction at announcement was 2.45 percentage points worse. Bidder shareholders appear to read a premium driven by an old peak as overpayment.
- Merger waves came when high market returns lifted likely targets close to their peaks, which made a peak-price offer easier to make.
For Gerald Rosenfeld, then chief executive of the investment bank Rothschild North America, the target's current price was the most important reference in a valuation and the 52-week high the second.
The purchase price as a personal anchor
A takeover target's peak price is shared by everyone in the negotiation. Each investor also carries a private anchor: the price they paid. It decides whether a position feels like a gain or a loss, and the result is the disposition effect, the habit of selling winners early and holding losers in the hope of getting back to even. In 10,000 US brokerage accounts from 1987 to 1993, investors realized 14.8% of the gains available to them and 9.8% of the losses, and the winners they sold went on to beat the losers they kept. Our article on loss aversion covers that study, the tax cost of the pattern and the housing market version of it.
Analysts and economists anchor too
Toward the industry. In US analysts' earnings per share forecasts from 1983 to 2005, analysts were too optimistic when a company's forecast earnings per share sat below the industry median, and too pessimistic when it sat above. The level of earnings per share depends on how many shares a company has issued, which says little about how profitable it is. Companies with forecast earnings per share above the industry median then earned abnormally high returns, concentrated around later earnings announcements. A portfolio long the most affected stocks and short the least affected earned a risk-adjusted 0.71% a month over the period studied. Firms with high forecast earnings per share were also more likely to split their stock, which brings the figure back toward the industry norm.
Toward last month. Consensus forecasts of monthly US economic releases from 1990 to 2006 were biased toward the values of the previous months' releases, which in some series produced sizable and predictable forecast errors. Bond yields reacted only to the unpredictable part of each surprise and ignored the part the anchoring made predictable.
Round numbers and IPO price ranges
Round numbers act as reference points in the order book. A random sample of more than 100 million US stock trades shows excess buying one cent below round numbers and excess selling one cent above them. The imbalance was largest next to whole dollars, then next to half dollars, and so on down the scale of roundness. Those trades, placed by traders demanding immediate execution, lost close to 1 billion dollars a year.
Initial public offerings add a published anchor: the price range in the filing. The average IPO in Tim Loughran and Jay Ritter's sample left 9.1 million dollars on the table, about twice the fees paid to the investment banks, yet issuers rarely complained. Their prospect theory explanation uses the midpoint of the initial price range as the reference point. When the offer is priced above that midpoint and the shares then jump on the first day, the owners feel a gain on the shares they keep that outweighs the money lost on the shares sold too cheaply. Issuers rated as satisfied by a measure built from that model were less likely to switch underwriters for their next offering, and paid those underwriters higher fees.
Listing prices, first offers and sentencing demands
In 1987 Gregory Northcraft and Margaret Neale gave real estate agents in Tucson a tour of a house and a ten-page packet with comparable sales and property details. The only difference between packets was the listing price. In the second experiment, the house was really listed at 134,900 dollars and had been appraised at 135,000 dollars a year earlier. The 47 agents averaged 8.9 years in the business.
| Listing price in the packet | Agents' mean appraisal |
|---|---|
| 119,900 | 114,204 |
| 129,900 | 126,772 |
| 139,900 | 125,041 |
| 149,900 | 128,754 |
A 30,000 dollar difference in the listing price moved the average appraisal by about 14,500 dollars. Asked afterwards, 8% of the agents named the listing price among their three main considerations. Students given the same packets were also moved by the listing price, and more of them mentioned it as a factor, 37% against 19% of the agents.
In negotiation, the first number on the table plays the same role. Across three negotiation experiments, whichever side made the first offer, buyer or seller, ended with the better deal, and first offers strongly predicted final prices, face to face and by email.
Trial judges with an average of more than 15 years of experience, given a prosecutor's demand of 34 months or 12 months for the same case, handed down sentences almost 8 months apart, even though the demand came from a computer science student playing the prosecutor. In later studies, legal professionals anchored on demands they knew were random, including demands they had set themselves by throwing dice.
Does the anchoring effect replicate?
Three large efforts have measured the effect since 2014.
| Study | What it tested | Result |
|---|---|---|
| Many Labs 1, 2014 | 13 classic effects in 36 samples, 6,344 participants, with four anchoring questions such as the height of Mount Everest | Anchoring produced some of the largest effects in the project, larger than the original study had reported. Two of the 13 effects failed to replicate |
| Li, Maniadis and Sedikides, 2021 | 53 studies of anchors on willingness to pay or to accept | Average correlation between anchor and valuation of 0.267, below the 0.32 to 0.52 of the social security experiment |
| Schley and Weingarten, 2026 | 2,601 effect sizes, 1,280 of them comparing high with low anchors | Average effect of 0.825 in Hedges' g, a large effect, still large after correcting for publication bias |
The Many Labs project gave anchors as information before each question, and the variation between samples may reflect what each one knew about Mount Everest, Chicago and the distance to New York. The 2021 meta-analysis of valuation studies found larger effects with anchors that were not random and in experiments outside the laboratory, and given the limits of the method, the average is best read as an upper bound. The 2026 meta-analysis in Management Science found reduced or null effects for anchors drawn from random numbers, for anchors on a different dimension from the judgment, for anchors met incidentally, and where incentives or debiasing interventions were present.
Debiasing methods tested against anchoring
Several fixes that seem obvious have failed in experiments:
- Warnings. Telling people about the bias and the direction in which it would push them did not reduce the effect in 1996 experiments.
- Expertise. Real estate agents and experienced judges anchored about as much as students.
- Money for accuracy. Payoffs did not reduce anchoring in 1974, and incentives had no discernible effect across the valuation studies pooled in 2021. The 2026 meta-analysis, which covers a wider set of tasks, found smaller effects where incentives were present, so the two reviews disagree on this point.
Considering the opposite, the method with experimental support among experts, works on selective accessibility. Before giving an estimate, the person lists arguments against the anchor. In the first of two studies published in 2000, run with experts in a real-world setting, listing arguments against the anchor value reduced the anchoring effect. In the three negotiation experiments, the first-mover advantage disappeared when the side that received the first offer thought about the other party's alternatives, the other party's reservation price or their own target.
Applied to investment decisions, these findings suggest a few habits:
- Write down a value range for a stock, a fund or a property before looking at its current price, its 52-week high or an analyst's target.
- When a number is already in view, list the reasons it could be wrong in each direction before settling on an estimate.
- Before a negotiation, set a target and a walk-away price and note the other side's alternatives, before the first offer arrives. Consider making the first offer when you know the value well.
- Judge a holding by whether you would buy it today at today's price. The purchase price and the old peak drop out of that question.
- Set order prices from your own analysis. Buying at 49.99 or selling at 50.01 dollars because 50 is round is the pattern that lost money in the round-number data.
Our comparison of active and passive investing covers the fees and results of each approach.
This article is general information, not investment advice.
Frequently asked questions
What is an example of anchoring bias in investing?
An investor who bought a stock at 100 dollars and watches it fall to 60 often judges every later price against 100 and waits to get back to it before selling. The purchase price says nothing about what the company is worth now. The same pattern appears in larger decisions: in 7,020 US takeover bids from 1984 to 2007, offer prices clustered at the target's 52-week high, and bids just above that high were 4.4 to 6.4 percentage points more likely to succeed.
Who discovered anchoring bias?
Amos Tversky and Daniel Kahneman named and described it in "Judgment under uncertainty: heuristics and biases", published in Science in 1974. They described it as the tendency for estimates that start from an initial value to stay too close to it, because the adjustment away from the starting point is usually insufficient. Their best known demonstration used a wheel of fortune that gave participants a number of 10 or 65 before they estimated the share of African countries in the United Nations.
What is the difference between anchoring bias and availability bias?
Both come from the same 1974 paper by Tversky and Kahneman. Anchoring concerns numbers: an estimate is pulled toward a value seen or computed just before. Availability concerns memory: people judge how frequent or likely something is by how easily examples come to mind, so a recent, vivid market crash can make another one seem more likely than the data suggest.
Is using an anchor always irrational?
No. A listing price, an analyst's forecast or last month's inflation figure often carries real information. The bias is the extra weight an anchor receives beyond its information content, and the fact that arbitrary numbers, such as a wheel of fortune result or the last digits of a social security number, move estimates too.
Can you avoid anchoring bias?
Not fully. Warnings, expertise and in several studies cash rewards for accuracy did not remove it. The method with the most support is to consider the opposite: list the reasons the anchor could be wrong before giving an estimate. It reduced the effect among experts in a 2000 study, and in negotiation experiments, focusing on the other side's alternatives or on one's own target removed the advantage of the party that made the first offer.