Nobody sitting in a traffic jam decided to cause it. Every driver just braked a little when the car ahead braked, and a few hundred of those small, sensible reactions added up to a line of stopped cars that no single person wanted or planned. Physicists have spent more than a century building tools for exactly this kind of situation: systems made of huge numbers of parts, each following simple rules, that together produce behavior none of the parts intended.
A stock market is one of those systems. Econophysics is what you get when physicists point those tools at it.
This guide assumes no physics, no calculus and no finance background. If you already know the basics and want the research papers, the models and the arguments over them, the full econophysics overview on this site goes much further.
So what is econophysics, in plain terms?
Econophysics is the use of methods from statistical physics to study markets and economies. Statistical physics is the branch that explains how the behavior of trillions of gas molecules adds up to something measurable, like temperature or pressure, without tracking any single molecule. Econophysicists make a similar bet about markets: that you can say useful things about millions of trades without knowing why any one trader bought or sold.
It helps to be clear about what it is not. Nobody in the field claims a share price obeys Newton's laws, or that a trader behaves like an atom. The borrowing is mathematical, not literal. Physics happens to have the best-developed toolkit for systems with many interacting parts and a lot of randomness, and markets fit that description well.
The name is recent. The physicist H. Eugene Stanley introduced the word "econophysics" in 1995, at a statistical physics conference in Kolkata, India. The timing was not a coincidence: by the late 1980s and 1990s, exchanges were recording every trade electronically, and physicists, who were used to sifting enormous noisy datasets from experiments, suddenly had market data on a scale economists had rarely worked with.
The starting point: a pollen grain and a coin flip
In 1827, the botanist Robert Brown looked through a microscope at tiny particles from pollen suspended in water and saw them jittering around in an erratic, never-ending dance. The motion, now called Brownian motion, turned out to be the particles being knocked about by water molecules too small to see.
The surprising part of the story is who described it mathematically first. It was not a physicist. On 29 March 1900, a French mathematician named Louis Bachelier defended a doctoral thesis at the University of Paris, Théorie de la spéculation, supervised by Henri Poincaré. It modeled the prices of securities traded on the Paris exchange as moving randomly, and in doing so it produced the first mathematical model of Brownian motion, five years before Albert Einstein's famous 1905 paper on the same phenomenon.
The idea at the heart of Bachelier's thesis, now called a random walk, is easy to picture with a coin:
- Start a make-believe share price at 100.
- Flip a coin. Heads, the price goes up 1. Tails, it goes down 1.
- Repeat a few thousand times and draw the result as a line.
What you get looks uncannily like a real stock chart, with trends, reversals and apparent "patterns" that are pure chance. This picture became a pillar of modern finance and underpins the efficient market hypothesis, the idea that prices already reflect available information and so move unpredictably. It also carries a quiet assumption: that if you tally up all the daily moves, they will form a bell curve.
Where the bell curve breaks
A bell curve, or normal distribution, describes things like adult height. Most people cluster near the average, and the further you get from it, the faster the numbers drop away. A man twice the average height does not exist. Under a bell curve, extreme values are not just rare, they become impossible for all practical purposes.
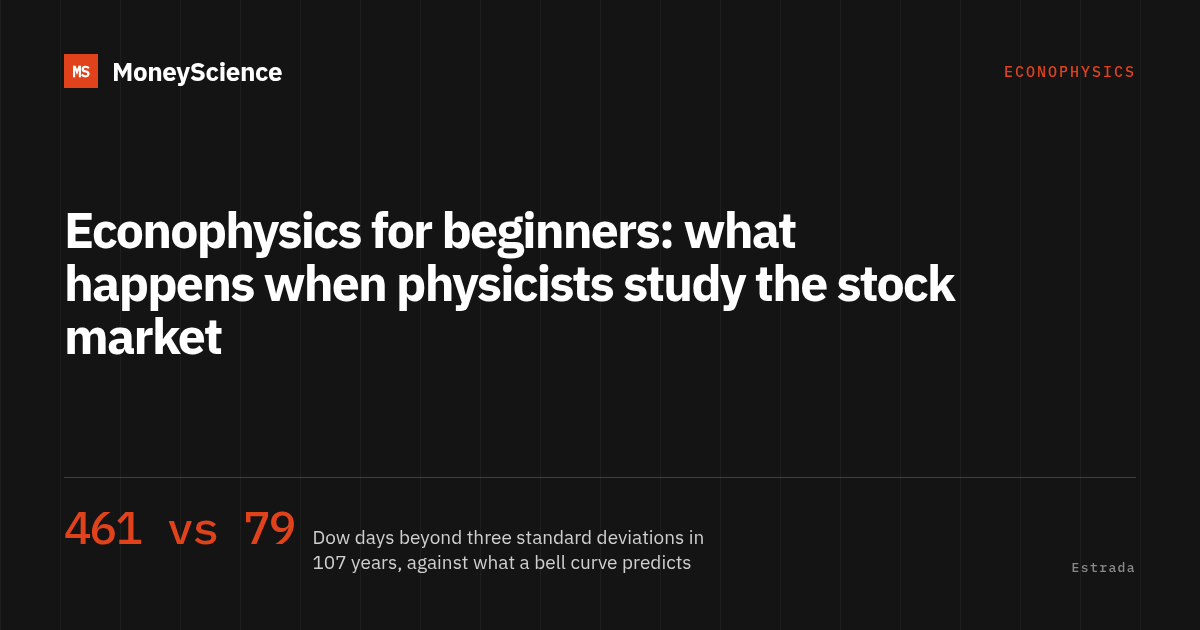
Markets do not behave that way, and the gap is large enough to see without any special equipment. The finance professor Javier Estrada looked at 107 years of daily returns on the Dow Jones Industrial Average, 29,190 trading days in all. If those returns followed a bell curve, about 79 days should have moved by more than three standard deviations, roughly 3% in either direction. The real count was 461, almost six times as many. A daily fall of 4.28% or worse should, on bell-curve math, turn up about once every 126 years. It happened 100 times.
Then there is 19 October 1987. On that Monday, the Dow fell 22.6% in a single session. Measured against the index's long-run daily standard deviation of about 1.07%, that is a move of roughly 21 standard deviations.
A bell curve says you would not expect to see a day like that even once if markets had been open every day since the Big Bang.
It happened anyway, within living memory. This mismatch has a name, fat tails, and documenting and explaining it is the most widely accepted contribution econophysics has made. The mathematician Benoit Mandelbrot saw it first in the 1960s, in cotton prices, and physicists picked the thread back up once they had millions of trades to count.
Five terms you will keep running into
Most introductions to econophysics lose beginners in the vocabulary. These five terms cover most of what you will meet in articles, books and talks on the subject.
- Fat tails
- A distribution has fat tails when extreme outcomes happen far more often than a bell curve predicts. The Dow figures above are a textbook case: the "tails" of the chart, where the biggest gains and losses sit, hold much more than they should.
- Power law
- A power law is a relationship where making an event bigger makes it rarer by a fixed ratio, however big you go. Earthquakes are the familiar example: for every magnitude 6 quake there are roughly ten of magnitude 5. In stock markets, research on tens of millions of trades found that the odds of a very large move fall off roughly with the cube of its size, so doubling the size of a move makes it about eight times rarer. Under a bell curve, doubling an already large move makes it so much rarer that it would effectively never happen.
- Volatility clustering
- Volatility clustering means turbulent days tend to follow turbulent days and calm days follow calm ones. Big moves arrive in bursts rather than being spread evenly over the calendar, which is why a single wild session is often a poor moment to assume things will settle down tomorrow.
- Phase transition
- A phase transition is a sudden collective change of state, like water freezing at zero degrees Celsius. Some econophysicists model crashes this way: as traders increasingly copy each other, the market drifts toward a tipping point and then shifts abruptly from calm to panic.
- Agent-based model
- An agent-based model is a computer simulation of many individual "agents", simplified traders or households, each following a few simple rules. Instead of assuming how the whole market behaves, you let the behavior emerge from the interactions and see whether it resembles real data.
A coin-flip game that ends in inequality
Econophysics is not only about stock prices. One of its most striking ideas concerns how wealth ends up distributed, and it starts with a bet that sounds like a good deal.
In a 2019 Scientific American article, the mathematician Bruce Boghosian described a casino game. You put 100 dollars on the table and a coin is flipped. Heads, the house pays you 20% of what is on the table. Tails, it takes 17%. Winning pays more than losing costs, so it looks like a game worth playing.
Now play two rounds, one win and one loss. You go from 100 to 120, then lose 17% of 120 and finish with 99.60. Because each bet is a percentage of whatever you have left, a win and a loss together leave you slightly poorer, and over many rounds most players drift toward nothing even though every single flip is fair and the average payout favors them.
Boghosian and his colleagues built a model of an economy on the same logic, called the yard-sale model. Pairs of people trade at random, and on each trade a coin decides who comes out ahead, with the amount at stake set as a fraction of the poorer person's wealth. Nobody cheats and nobody is more skilled. Run it for enough transactions with a thousand agents and one of them ends up holding almost all the wealth while the other 999 are left with close to none.
Real economies are not coin flips, and the model on its own is too extreme. But when the researchers added a simple form of redistribution, where each agent takes a small step toward average wealth, and a few further refinements, they reported that it matched data on wealth distribution in the United States and Europe between 1989 and 2016 to within 2%. Whether that fit explains how inequality arises, or just describes its shape, is still argued over. It is a good example of the econophysics method at its most ambitious: very simple rules, a very large number of interactions, and a result that looks surprisingly like the real world.
What any of this means if you invest
None of this is a trading strategy, and econophysics does not tell you what to buy. What it does is correct some comfortable assumptions that sit underneath a lot of everyday investing advice.
- Bad days are more common than risk numbers suggest. Any estimate of "how much could I lose" that quietly assumes a bell curve will understate the chance of a severe fall. The 1987 crash and the Dow's hundred 4%-plus drops are not freak exceptions to the model. They are what the data looks like.
- Diversification is weakest when you need it most. A study of international stock markets by François Longin and Bruno Solnik, published in the Journal of Finance in 2001, found that correlation between markets increases in bear markets, but not in bull markets. Holdings that seem to move independently in normal times can fall together in a slump.
- Turbulence clusters. After a violent day, the next few days are more likely than usual to be violent too. Volatility clustering is a reason to be wary of assuming a calm return to normal straight after a shock.
- Crowds amplify. The phase-transition view of crashes connects closely to herding, one of the behavioral biases that cost investors money. The more everyone copies everyone else, the more fragile the whole system becomes.
The common thread is humility about risk. Econophysics gives very good reasons to expect extreme events and much weaker tools for predicting their timing.
The fair criticisms
Econophysics has critics, and some of their points land. Economists note that fat tails were not a physicist's discovery: Mandelbrot published his work on cotton prices in an economics journal, the Journal of Business, in 1963, decades before the word "econophysics" existed. A well-known 2006 critique argued that some econophysics papers rediscover results already established in economics without citing them, and stretch physical analogies further than the data supports.
The fairest summary is that the measurements, fat tails, power laws and volatility clustering, have been absorbed into mainstream risk management, while the grander claims that markets obey something like physical laws remain contested even among people sympathetic to the field. The econophysics overview covers that debate in more detail.
Where to go next, from easiest to hardest
- The Physics of Wall Street, James Owen Weatherall (Houghton Mifflin Harcourt, 2013). A narrative history, from Bachelier to modern quantitative funds, written for general readers.
- The (Mis)Behavior of Markets, Benoit Mandelbrot and Richard L. Hudson (Basic Books, 2004). Mandelbrot's own case against the bell curve, pitched at a popular audience and written without equations.
- Why Stock Markets Crash, Didier Sornette (Princeton University Press, 2003). The phase-transition theory of crashes from the physicist most associated with it. Some math, but the argument can be followed without it.
- An Introduction to Econophysics, Rosario Mantegna and H. Eugene Stanley (Cambridge University Press, 2000). The field's first textbook. You will need probability and some calculus.
Frequently asked questions
Do you need to know physics or advanced math to understand econophysics?
Not to understand its main ideas. The core findings, that extreme market moves happen far more often than a bell curve predicts, that big moves come in clusters, and that simple interactions between many traders can produce crashes and inequality, can all be explained with coin flips and everyday examples. Reading the research papers themselves does require probability, statistics and calculus.
Is econophysics the same thing as quantitative finance?
No, but they overlap. Quantitative finance is the practical discipline of pricing, trading and managing risk with mathematical models, and it draws on statistics, economics and computer science as well as physics. Econophysics is a research field that looks for statistical regularities in market data and explains them with models borrowed from physics. Many of its findings, and several of its researchers, have moved into quantitative investment firms.
Can econophysics predict stock market crashes?
Some econophysicists, most prominently Didier Sornette, argue that bubbles leave a measurable pattern before they burst and that crashes can in principle be anticipated. Those models have produced false alarms and are still debated. What econophysics has established with much more confidence is that crashes are far more likely than classical finance models assume, which is not the same as knowing when the next one will happen.
What is the simplest example of econophysics in action?
Counting how often large daily stock market moves happen and comparing that with what a bell curve predicts. Over 107 years of Dow Jones data, a bell curve implied about 79 days with moves beyond three standard deviations. There were 461. Explaining that gap, and building models that reproduce it, is much of what econophysics does.